The U.S. housing market has seen a lot of changes over the last 30 years, when the Harvard Joint Center for Housing Studies first started publishing its State of the Nation’s Housing Report. The 2018 edition investigates these changes we’ve seen since 1998, and also considers what homeowners and potential homeowners might expect to see next.
Decades Of Housing Market Action
In the 1980s, high interest rates were a roadblock for many potential homeowners. Yet today, this big barrier to homeownership still exists — even with lower interest rates. For young adults experiencing soaring housing costs, weak income growth, and higher overall debt levels — including more student loans — there’s just a lot going on. All of these factors are contributing to a lower number of homeowners, and the growth of income inequality is contributing to the increase in cost-burdened households.
What Does It Mean To Be A Cost Burdened Household?
The U.S. Department of Housing and Urban Development, or HUD, defines a cost-burdened household as one that spends more than 30% of its total income on housing, because it might lead to difficulties in affording other necessities such as food, clothing, transportation, and medical care.
“If incomes had kept pace with the economy’s growth over the past 30 years, they would have easily matched the rise in housing costs,” explains Daniel McCue, a senior research associate at the Harvard joint Center for Housing Studies and lead author of the report. “But that hasn’t happened.”
The effects of rising home prices and weak income growth are showcased by the national home price to income ratio, which stands at 4.2 as of 2017. There are 22 metro area housing markets with a ratio above 6.0; however, back in the original State of the Nation’s Housing Report in 1988, the national average was 3.2 (with only one metro above 6.0).
Housing Market Changes In Renting & Building
Over the last decade there has been an uptick in the number of renters and rental properties, but that trend is shifting and stabilizing back toward homeownership. This could be for a few reasons, including more millennials are now finally entering the housing market after waiting a bit longer than previous generations to buy their first home.
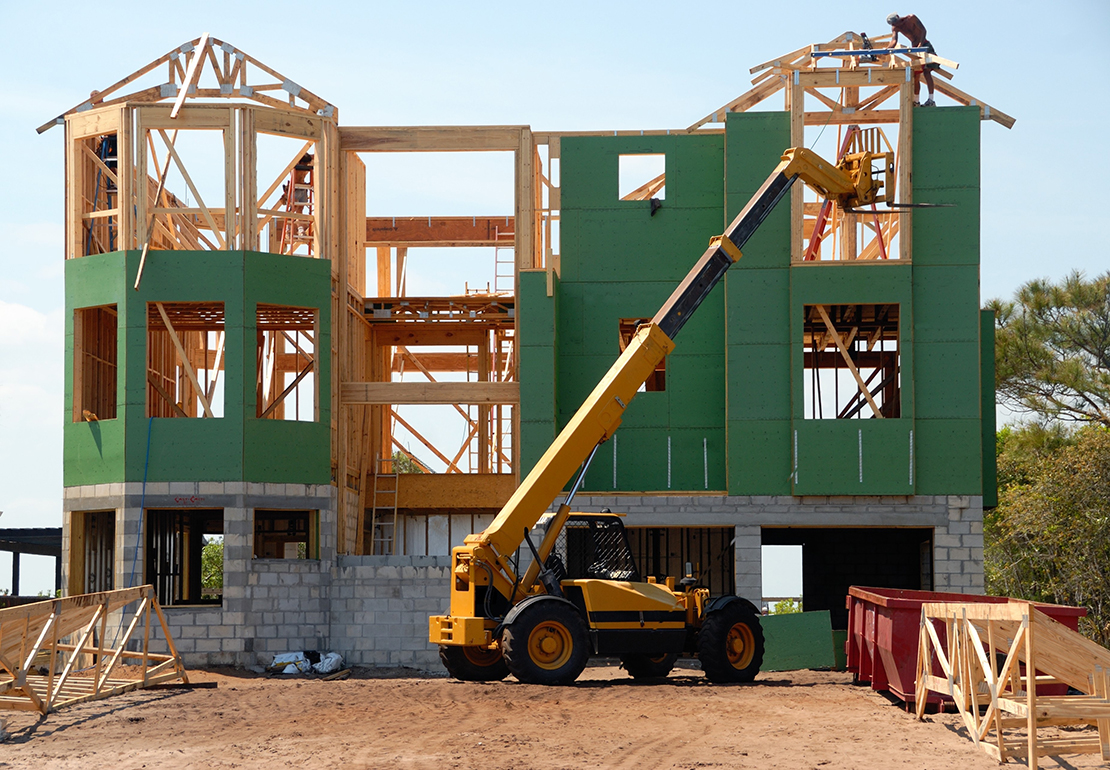
Single-family home construction has taken a downturn after six consecutive years of increasing numbers; the U.S. housing market saw 849,000 single-family homes built in 2017 — well below the longstanding average of 1.1 million a year. When new construction is limited, it can also cause existing home sales to decrease because current homeowners won’t have as many options on the market to move into a bigger home or a different neighborhood, so they may be less likely to put their own home on the market.
The Housing Market As A Whole
Overall, new construction, home sales, and housing prices saw a modest uptick in 2017, but a slowdown in the multifamily sector paired with the rising costs of residential construction are likely preventing a stronger upturn. With supply low, competition continues to be intense — and it’s pushing up prices in metropolitan areas. Thus, concerns for affordability persist amongst industry experts.
Regardless of the housing market changes, you can best empower yourself by researching your local real estate market. If you’re interested in learning more about your dream of homeownership in today’s housing market, get in touch with a pro at Mr. Cooper.


